
The Warehouse Management KPIs To Improve Performance Across the Board
11 min read
Key takeaways
- Most supply chain scorecards confirm that a shipment arrived late or cost more than planned, but very few explain why, because the gate and yard events behind the miss go unmeasured.
- Without captured gate and yard timestamps, gate processing time stays an estimate and detention invoices arrive with no arrival-to-departure record your team can check them against.
- Vector captures those events through FastPass check-in by SMS, app, or kiosk and feeds them into the WMS, TMS, and ERP platforms already in use, including SAP, Oracle, and Blue Yonder.
- Industry-wide detention or turnaround benchmarks make unreliable targets because lane mix, facility type, and carrier roster differ, so baselines should come from your own comparable operations.
Most supply chain scorecards confirm that a shipment arrived late or cost more than planned. Fewer explain why. That gap matters if you own service levels and freight spend across several facilities, because the answer usually sits in events that go unmeasured.
Yard and gate activity often hides the explanation. Trailer locations go unrecorded, so “where’s my load” calls land on your team. Gate and departure times go uncaptured, so detention invoices arrive without a record you can check them against. Document status stays unknown, so loads sit unbilled.
The measures below cover the warehouse, gate, yard, carrier, and document side of performance, so you can trace a missed window back to the interval that caused it. Start with the short answer on which supply chain KPIs matter most, then work through the facility-level measures that explain each outcome.

Ready to transform your supply chain?
Increase efficiency and productivity. Say goodbye to delays, handwriting errors, and time-intensive manual data entry.
Transportation KPIs That Protect Service and Freight Spend
Executive summary: Carrier scorecards need scheduled pickup, actual pickup, promised delivery, and complete delivery timestamps together, because late door assignments and undocumented arrivals often cause apparent carrier failures.
A carrier scorecard should show service performance, waiting time, and avoidable charges together. Treating on-time delivery as a carrier-only metric often misses the cause. A missed pickup may trace back to a late door assignment. A detention invoice may trace back to an undocumented arrival.
Gate timestamps help you move those conversations from blame to diagnosis.
On-time Pickup, Delivery, and OTIF
On-time delivery and OTIF measure different things. On-time delivery tracks whether the shipment arrived by the promised date. OTIF requires both that timing and a complete order: every unit, in acceptable condition, with accurate documentation.
Track four timestamps separately: scheduled pickup, actual pickup, promised delivery, and complete delivery. Each has its own denominator and tells a different part of the story.
A missed OTIF target may result from a carrier delay, a short pick, or a documentation error. It may also trace back to a late door assignment or a trailer sitting too long at the dock, pushing back the departure time.
Investigating each cause requires interval data to connect the facility event to the delivery outcome.
Without gate and yard events, you can report an OTIF miss. But you can’t identify where it originated. Link gate timestamps, dwell intervals, and delivery confirmations from booking through delivery. Together, they show whether a late door assignment contributed to a missed window.

That’s the difference between reporting the metric and improving it, and why connecting shippers, carriers, and receivers across the full delivery lifecycle turns OTIF from a lagging score into something diagnosable.
Detention, Demurrage, and Freight Cost
Track detention frequency, detention dollars per affected load, accessorial dollars, and freight cost per unit as four separate measures. Combining them masks which problem is driving cost.
Detention depends on your agreed free-time window and contract terms. Total dwell is not automatically billable. Review each charge against the applicable carrier agreement before approving payment.
Demurrage is a separate concept. It applies to container or equipment-return workflows, not to driver waiting at a dock. Using the terms interchangeably makes both harder to manage.
Freight budgets often absorb uncontested accessorial charges when the supporting records are informal rather than timestamped.
Retaining appointment, arrival, door-assignment, and departure records gives you a precise arrival-to-departure interval. That’s what you need to contest or approve a charge. Without those records, the dispute has no foundation.
Carrier Scorecards and Capacity Conversations
Scorecard data becomes most useful when you compare carriers on the same routes with the same service commitments. Measure pickup punctuality, delivery punctuality, appointment variance, truck dwell, and disputed accessorials together.
A carrier with strong on-time numbers but high dwell may be absorbing your facility-side delays. That’s worth investigating before drawing conclusions about carrier performance.
Frame scorecard conversations as joint improvement discussions, not performance verdicts.
A score does not guarantee capacity access in tight markets. But shorter dwell times and fewer disputed accessorial charges make your facilities easier to work with.
When you share trailer status with carriers and dispatchers, both sides spend less time on the calls and emails needed to track down trailer locations and ETAs. That reduction in back-and-forth, fewer delays and less time lost coordinating can contribute to the smoother driver experience that underpins Shipper of Choice positioning.
Gate and Yard KPIs That Explain Driver Wait
Executive summary: Driver wait breaks into gate queue, parking assignment, dock wait, loading, and paperwork intervals, and measuring appointment variance separately from gate-processing time pinpoints the responsible step.
A long driver wait is rarely one unexplained delay. It is several distinct intervals: gate queue, parking assignment, dock wait, loading, and paperwork. Each one is measurable on its own. Track those intervals separately, by facility, shift, carrier, and direction. Then you can see exactly which step is causing the wait and reassign staff, adjust dock scheduling, or flag the carrier for follow-up.
Appointment Arrival and Gate Processing
Track two separate measures here: appointment variance (the difference between scheduled check-in and actual arrival) and gate-processing time (arrival to completed check-in). Each reveals something different.
Appointment variance tells you how well your door schedule reflects reality. Gate-processing time tells you how efficiently the facility converts an arrived truck into a checked-in one.
Off-plan arrivals, early, late, or unannounced, are common. When they happen, dock crews may not have a door ready, or a committed door sits idle while another load waits at the gate. Vector’s FastPass lets drivers check in via SMS, app, or kiosk before reaching the gate, without downloading anything or leaving the cab. That cuts the time drivers spend at the gatehouse.
Watch: Vector: Streamlining Driver Check In at Warehouses and DC’s
Shows the exact FastPass SMS, app, or kiosk check-in workflow described in this sentence.
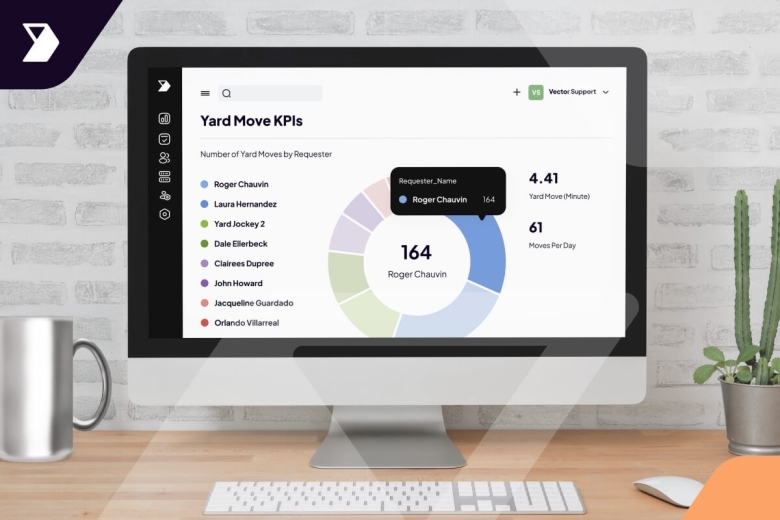
It’s also one way to capture the gate events that make gate-processing time measurable, with timestamps tracked in Vector’s yard management system. Without those timestamps, gate-processing time remains an estimate. With them, your team can identify which shifts, carriers, or arrival types take longest to clear.
Door Assignment, Loading, and Trailer Turn
Total dwell hides more than it reveals. Break it into three intervals: check-in to door assignment, door assignment to trailer seal, and seal to checkout. Each one points to a different problem.
Once you have those intervals, add three capacity measures: trailers processed per day, door utilization, and trailer availability. Define the denominator for each at your facility. Trailers processed per day means something different at a cross-dock than at a single-tenant DC. A utilization rate can look healthy on paper.
But it may hide a bottleneck that only shows up on one shift.
Together, these measures tell your team whether congestion is a scheduling, labor, or paperwork problem. That distinction determines the fix. Vector’s dock assignments are designed to act on that sequence, connecting what your consistently monitored interval data reveals to the door-assignment decisions that follow.
Trailer Visibility and Yard Audits
Manual audits often require staff to walk the yard multiple times a day to answer one question: where is that trailer? When location data isn’t consistently monitored, your team fields a steady stream of status requests, pulling them away from work that moves freight.
When you know a trailer’s physical location, door status, and movement history, you can assign a spotter, confirm a dock door, or update a carrier without leaving your desk.
Track two numbers before setting improvement targets: how often trailer-status records are missing or stale, and how much staff time goes to manual audits. Those are your baselines.
Trailer tracking and yard audits work without adding expensive RFID infrastructure. That approach reduces the frequency of physical validation rounds and lets your team shift focus toward exception management rather than routine confirmation walks.
Warehouse KPIs Behind Order and Dock Performance
Executive summary: Inventory accuracy governs whether a release happens on schedule, and receiving cycle times reveal when inbound trailers occupy dock doors that outbound shipments need.
Warehouse KPIs matter because each group affects handoff timing with the yard, the dock, or the carrier. Inventory accuracy determines whether a release can happen on schedule. Receiving cycle times show whether inbound trailers are occupying dock doors that outbound shipments need.
Your team can use these measures to make decisions at each handoff. That shifts the focus from reporting outcomes after the fact to acting while there’s still time.
Inventory Accuracy and Availability
Inaccurate inventory records often prevent an order from releasing on time. When records drift, your team can’t confirm which stock is available, and that uncertainty delays the release while a trailer waits at the door.
Inventory accuracy measures how closely system records match physical counts. Shrinkage tracks unexplained losses; assets with no matching record effectively disappear from the system.
Carrying cost signals whether buying patterns are creating excess stock. Inventory turnover divides cost of goods sold by average inventory. Keep both figures from the same period. The inventory-to-sales ratio adds context about whether stock levels match demand.
Order Fulfillment and Customer Service
This section covers eight order-fulfillment metrics: fill rate, on-time delivery, order cycle time, perfect order rate, picking accuracy, backorder rate, order lead time, and returns. Each measures a distinct moment in the order’s journey.
Order lead time ends when the shipment departs. Order cycle time ends when the customer receives it. Keeping those denominators separate helps your team identify whether a missed commitment originated inside the warehouse or downstream.
Perfect order rate is where documentation earns its place. A shipment that arrives complete and on time but triggers an invoice dispute is not a perfect order. Include document accuracy in your definition of a perfect order from the start.
When a commitment is missed, the cause often sits at a handoff. A late door assignment delays a pickup. An incomplete BOL delays a receiver’s approval. Name the specific handoff point before the cross-functional conversation starts. That keeps the discussion focused on fixing the interval, not assigning blame.
Receiving, Putaway, and Space Use
Receiving time, receiving accuracy, putaway time, putaway accuracy, and putaway cost per unit each measure a distinct step. An inbound trailer arriving at the gate, a door becoming available, and inventory becoming usable in the WMS are three separate milestones.
Dock-to-stock time spans all three. Storage-space utilization, storage density, and space fill rate then show whether the inventory that made it through that sequence has a place to go.
Cross-dock operations add pressure to every interval. Arrival times often vary. Departure windows may shift too. When your team can’t quickly match inbound freight to an open door and an outbound departure plan, the schedule breaks down.
The platform keeps dispatchers and warehouse teams aligned on inbound shipment data and dock status. Your team can then match arriving freight to available doors sooner rather than waiting for manual confirmation.
Documentation KPIs That Keep Loads and Invoices Moving
Executive summary: Mobile scanning or OCR at gate kiosks automatically indexes BOLs and PODs to the correct load, cutting the days billing teams spend chasing paperwork.
Document return time and invoice-ready time are two measurable operating KPIs for this part of the workflow. The percentage of loads with a complete document package and the documentation-related dispute rate are two more. Define the start and end events for each measure before publishing results.
Billing teams may wait days, or even weeks, for PODs. That wait is not inevitable.
Bills of Lading, Proof of Delivery, and Invoice Readiness
At each handoff, your team needs the BOL associated with the load before departure and the POD confirmed at delivery. When you capture those documents through mobile scanning or OCR at gate kiosks, automated indexing links the record to the correct load, reducing manual steps between capture and billing.
That attachment means your billing team doesn’t have to chase down documents before issuing an invoice.
Many freight operations often rely on paper documents. That often means the billing clock may not start until someone manually processes a paper return. The eBOL solution mirrors those paper documents in a connected record, giving your team a digitally accurate proof of delivery without changing how drivers work, one way to close the gap between delivery confirmation and a load that’s ready to bill.
Timestamped Evidence for Carrier Disputes
When reviewing a detention or invoice exception, gather your appointment timestamp, arrival record, door assignment time, and departure timestamp. Then compare those records to the relevant carrier agreement before drawing conclusions.
The timestamps show when each event occurred and who signed. The contract determines whether a charge is valid.
These records can support dispute resolution without guaranteeing its outcome. A timestamp alone does not establish who owes a charge. It shows what happened and when, giving your team a factual starting point rather than a reconstructed account. The audit trail of electronic signatures, timestamps, and geocoordinate stamps is built to be retrievable the moment a dispute arrives.
Safety, Labor, and Sustainability KPIs with an Operational Purpose
Executive summary: Near-miss counts and compliance rates read alongside guard hours and administrative time show whether safety gains came at the cost of labor spend.
Safety, labor, and sustainability measures are worth tracking alongside gate and dock KPIs in the same operating review. Three measures help here: lost-time injury frequency rate, near-miss count, and safety compliance rate. Together, they show where yard or dock activity may be creating safety risk.
Energy per processed unit, emissions per shipped unit, and waste recycling rate connect facility decisions to cost and reporting obligations.
Yard Safety and Staffing
Review near-miss reports and safety compliance rates alongside truck and spotter movement records. Track guard hours and administrative time, the labor costs your site controls directly. These two inputs show whether you’re reducing safety incidents while also controlling labor costs, or trading one for the other.
Automated or SMS-based check-in reduces physical movement across the yard during arrival. Keeping drivers in their vehicles during check-in reduces pedestrian-vehicle conflict at the gate.
The platform supports guardless and autonomous yard configurations, while preserving site-specific safety and access controls. Staffing outcomes will vary by site, volume, and access requirements.
Energy and Emissions Per Unit
Volume-normalized measures let you compare periods fairly. A month with lower shipment volume may show reduced total energy use without any operational improvement.
Define your boundary and denominator before comparing sites. Energy per processed unit and emissions per shipped unit can mean different things across facilities, for example, if one site includes refrigeration and another does not.
Your yard management system can pull gate and dock data captured across the yard into compliance reporting for CARB, TRU, FSMA 204, and WAIRE (Southern California operations only), though these programs also require data from other systems.
Turn Warehouse KPIs into Live Operational Signals with Vector
Tracking warehouse KPIs means nothing if the underlying data arrives late, lives on paper, or stops at the fence line. Dock cycle times, dwell, OTIF, and receiving accuracy all depend on events being captured the moment they happen, not reconstructed from clipboards and phone calls hours later.
Vector digitizes the entire shipment lifecycle, from gate arrival through dock assignment to signed delivery, so every warehouse metric comes from the workflow itself rather than manual reconciliation:
- Timestamped Digital Audit Trail: Vector’s eBOL captures electronic signatures, timestamps, and geocoordinate stamps on every transaction, creating verifiable event data behind dwell, cycle time, and delivery performance metrics.
- FastPass® Check-In and ETA Visibility: Geofenced check-ins via SMS, app, or kiosk, with real-time ETA tracking and dynamic dock assignments, provide accurate arrival-to-dock measurement while reducing wait times and OTIF penalties.
- Real-Time Trailer Tracking Without Hardware: Vector’s YMS delivers continuous visibility into trailer locations and trailer pool availability analytics with no RFID tags or costly hardware required.
- Automated Data Flow Into Existing Systems: Yard truck activity and shipment data feed directly into WMS, TMS, and ERP platforms including SAP, Oracle, Manhattan Associates, and Blue Yonder through API, EDI, and email connectors.
- AI Exception Surfacing: AI imaging converts unstructured shipping documents into structured data, flags missing or inaccurate information, surfaces exceptions, and detects cargo mix discrepancies before they distort performance reporting.
Explore Vector to see how yard and dock data can transform the way you measure warehouse performance.
Published on April 29, 2024
Last updated on October 27, 2026
Subscribe to stay updated on Vector and logistics trends
" " indicates required fields

Continue reading

Ready to transform your supply chain?
Increase efficiency and productivity. Say goodbye to delays, handwriting errors, and time-intensive manual data entry.